Defaults
Non-Financial Chart of Accounts
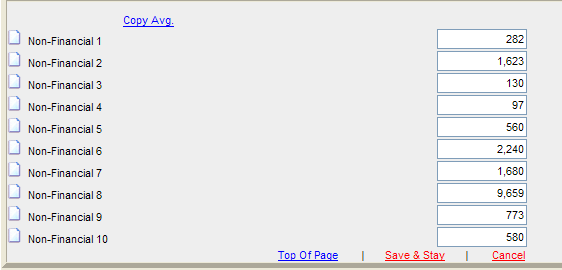
Non-Financial Chart of Accounts for Agriculture, Commercial, and Personal loan types serve as data entry fields for the Balance Sheet and Income/Expense screens. The data from these fields is used in the calculation of customized ratios. The data is needed to calculate per unit revenues or costs.
Following is an example of a non-financial ratio.
Gross Revenues of $100,000 divided by 50 hospital beds = $2,000 revenue/bed
The number of hospital beds is the non-financial information. Non-Financial Chart of Accounts are not part of the calculations for Quarter by Quarter, Quarter by Quarter Trends, or Rolling Financials, or Rolling Financials Trends.
Activate Non-financial Chart of Accounts
Non-financial chart of accounts are activated from the Defaults menu of Lending Cloud.
-
For balance sheet screens, select Defaults > Balance Sheet > Chart of Accounts > Setup Drop List.
-
For the income/expense screens, select Defaults > Income/Expense > Chart of Accounts > Setup Drop List.
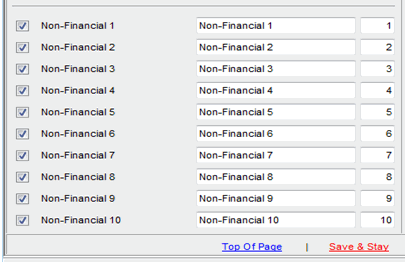
Customized Ratios
Like the traditional chart of accounts, you can add non-financial chart of accounts to customized ratios. In Lending Cloud, select Defaults > Customize > Ratios > Setup Ratios.
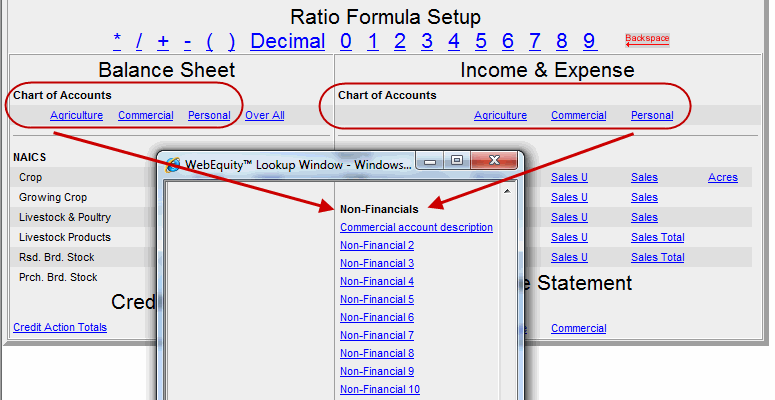
Models
Like the traditional chart of accounts, you can select non-financial chart of accounts on the Defaults Balance Sheet and Income/Expense setup drop lists models. If selected, you can use them on the customer Balance Sheet Summary, Balance Sheet Trends, Income/Expense and Income/Expense Trends screens.
-
For balance sheet models, select Defaults > Balance Sheet > Chart of Accounts > View link
-
For income/expense models, select Defaults > Income/Expense > Chart of Accounts > View link
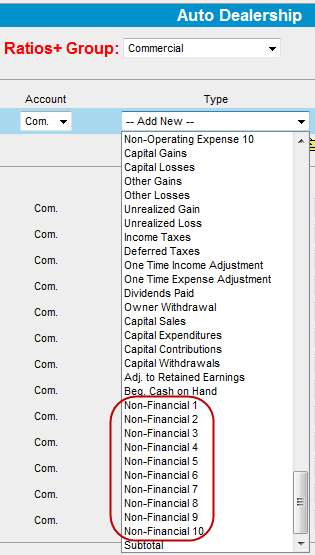
Balance Sheet Chart of Accounts
If added to the Balance Sheet Trends and Balance Sheet Summary screens, non-financial chart of accounts appear just like traditional chart of accounts for data entry purposes. The Non-Financial Chart of Accounts dollar amounts are not affected by the selection of Whole Numbers, Thousands, or Millions.
Balance Sheet Trends Screen

Balance Sheet Summary Screen
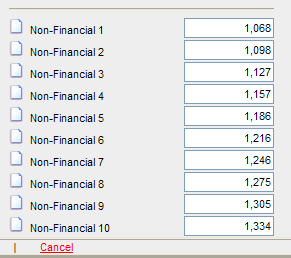
Income/Expense Chart of Accounts
If added to the Income/Expense Summary and Income/Expense Trends screens, non-financial chart of accounts appear just like traditional chart of accounts for data entry purposes. For the Income/Expense Trends screen, the Non-Active Years column is view only. The Average column is calculated for the non-financial just like the income and expenses. The numbers in the Average column are rounded to the nearest whole number. The Non-Financial Chart of Accounts dollar amounts are not affected by the selection of Whole Numbers, Thousands, or Millions.
Income/Expense Trends Screen

Income/Expense Summary Screen
Reports Setup Screen
You can have the Non-Financial Chart of Accounts appear on your reports. To turn on or off this feature, select the Print Non-Financials check box on the Reports Setup screen.
Return to Balance Sheet Charts of Accounts