Balance Sheet Trends Screen
Lending Cloud provides balance sheet trends for calculating the percentage change for one account over a period of time of two years or more. All columns containing data input fields are open and can be edited by moving horizontally across the page using your Tab key. You can also maneuver around the screen using your Enter key. If you prefer to use the individual balance sheet (Summary Input), it can be accessed by clicking on the date link at the top of each column.
Click here to view a high-level overview of the trends screen functionality (requires the Adobe Flash Player).
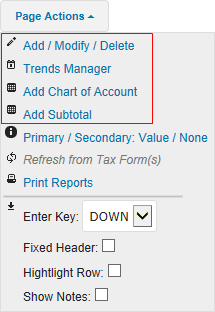
Functionality here is controlled by using the Page Actions drop list in the top right corner of the trends screen. You can choose how you want the cursor to behave by choosing the direction in the Enter Key drop list (Right or Down).
Click directly on the features denoted by red boxes in the image on the right to learn more about that feature.
The drop down feature within each cell is used to create a Schedule, add or edit Comments and Formulas. Formulas can be typed directly into the cell (Math in a Cell) and also edited within the cell. Clicking the Schedule"item displays the schedule level detail dialog box.
Once schedule level data is applied, the cell will be grayed out and the drop down arrow becomes a triangle. To edit the schedule level data, click the triangle and click Schedule.
The Chart of Accounts column can be edited by clicking on the drop down menu within each account. Here you can change the Collateral Discount, Duplicate or Delete an account. The account can also be renamed by simply clicking on the account name and typing directly into the cell. To re-order or reposition an account, click and hold the Double Bar icon that appears left of the account name and then drag and drop the account where you want it. |
|
Additional Features
The links on the top-left corner of the trends screen:
- Ratios+: Displays a pop-up window to show any ratio groups
associated with this trends screen.
- Ratios: Displays a pop-up window to show any ratios associated
with this trends screen.
- SOE: Displays the Statement of Owner Equity pop-up window.
- SCF: Displays the Statement of Cash Flows pop-up window.
- Ratios+: Displays a pop-up window to show any ratio groups
associated with this trends screen.
The SOE and SCF pop-up windows have icons on the far right of the title bar. The first is to refresh the data in the window and the other is to attach the data to the trends screen.
![]()
Once the SOE and/or SCF data has been attached to the trends screen, an additional up/down arrow displays for you to expand/collapse the data.
Whole Numbers, Nearest Thousands and Nearest Millions
You can enter, show, and report numbers in Lending Cloud as whole numbers, nearest thousands and nearest millions. Click Whole Numbers, Thousands and Millions for more information.
Math in a Cell
You can enter math formulas in user-defined cells on the summary and trends screens to perform math calculations. You can type addition, subtraction, multiplication, division calculations and parenthesis within the math calculations. For more information, click Math in a Cell.
In and Out of Balance Indicator
If total assets do not equal total liabilities and equity, the variance (s) and the following message appears at the bottom of the report and in the Agriculture and Commercial sections: OUT OF BALANCE: Assets do not equal Liabilities & Equity Accounts
If total assets do equal total liabilities and equity, the following message appears at the bottom of the report and in the Agriculture and Commercial sections: IN BALANCE.
Save & Stay or Cancel Symbols
If you change data and then click the Save & Stay button, the data will be saved with the changed data.
If you change data and then click the Cancel button, the data will not be saved and the page will refresh with the original data.
However, if you change data you do not have to click the Save & Stay button to save the changed data before clicking a hypertext link to open a new window. The page will save the data if you navigate away from the page using any hyperlinks or the menu. It will also save the data on hyperlinks that open pop-up windows where the data needs to be saved before the window is generated.
Footnotes and eSignatures
At the bottom of the trends screen is an enhanced footnotes area where you can click on each year's date and enter notes specific to that year's data. The same is true for the eSignatures below the footnotes.