Income Expense Menu
Rolling Financials
You can connect monthly and quarterly financial statements in a trailing or rolling format, such as in the following examples:
Monthly
07 2009, 08 2009, 09 2009, 10 2009, 11 2009, 12 2009, 01 2010, 02 2010, 03 2010, 04 2010, 05 2010, 06 2010
Quarterly
Q3 2009, Q4 2009, Q1 2009, Q1 2010, Q2 2010
On the Rolling Financial summary screen, you can use addition and subtraction of year-to-date financial statements to arrive at a 12-month consolidation, such as in the following examples:
Addition
Q2 2009 (+) Q3 2009 +Q4 2009 + Q4 2009 + Q1 2010 = Annualized Financial Statement
Subtraction
Annual 2009 + Q1 2010 - Q1 2009 = Annualized Financial Statement
Financial statement periods can include a combination of historical and projected financial statement information. To open the Rolling Financial summary screen, click the Inc/Exp menu, point to Rolling Financial, and click the quarterly financial summary you want to calculate. Upon opening the Rolling Financial summary screen, two columns appear. You can add up to 10 additional columns. For each column, you can select a financial statement from the Income/Expense Add/Modify/Delete screen. Any changes you make to the income/expense statement flow to the rolling financial summary after you save it. The rolling financial statement you calculated and the total column are updated.
Rolling Financial Add/Modify/Delete Screen
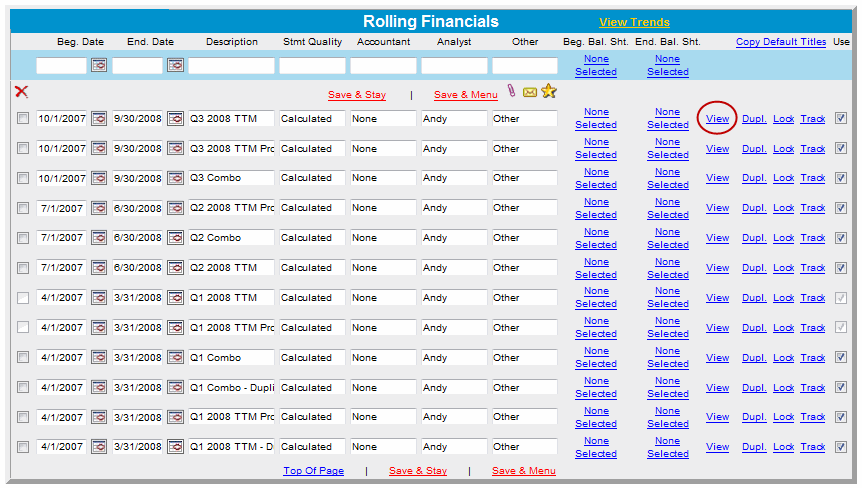
On the Rolling Financial Add/Modify/Delete screen, you can define time periods for monthly or quarterly financial statements that can be used to calculate the totals for a financial statement. Each financial statement from the Add/Modify/Delete screen can only be selected once per financial summary.
The following example describes how to calculate a financial statement for the second quarter 2007:
Define the time period in the Beg. and End. Date fields.
Type a description for the financial statements in the Description field.
Click Add.
Repeat above steps for each additional statement.
Click View on the Q3 2008 TTM line.
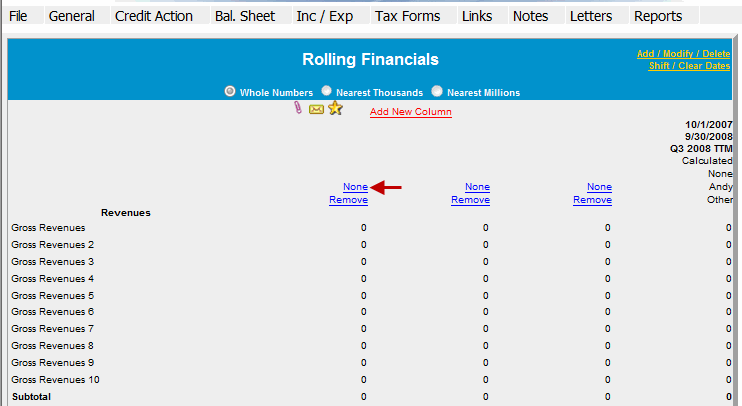
On the Rolling Financials summary screen, click None in the first column.
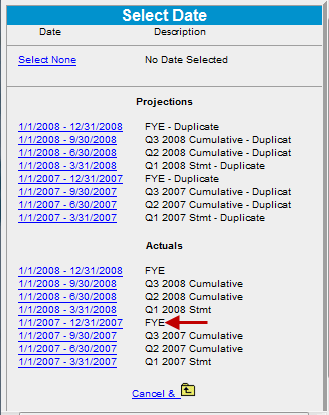
On the Select Date dialog box, select the 1/1/2007-12/31/2007 FYE statement.
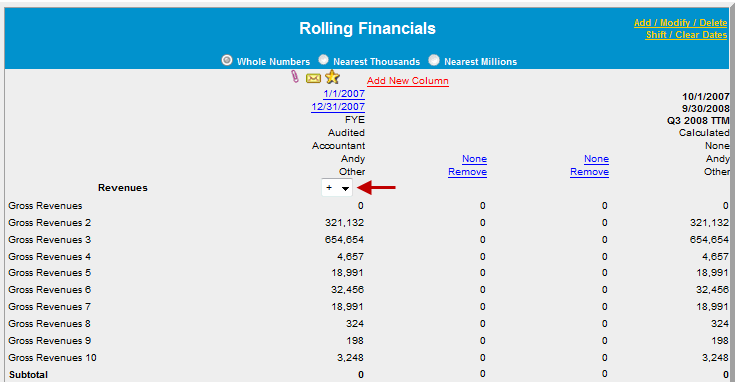
Ensure that the plus (+) sign appears in the first column.
On the Rolling Financials summary screen, click None in the second column. On the Select Date dialog box, select the Q3 2007 Cumulative.
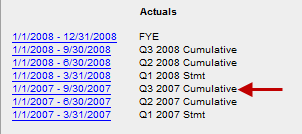
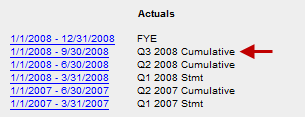
Ensure that the minus (-) sign appears in the second column. On the Rolling Financials summary screen, click None in the third column. On the Select Date dialog box, select the Q3 2008 Cumulative.
The numbers in the columns tally across to calculate the Q3 2008 TTM financial statement.
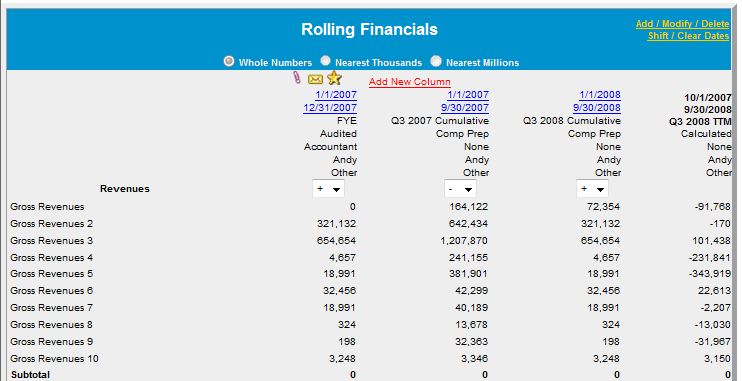
Note: You cannot make edits on this screen, except select the financial statements and have them added or subtracted. Make changes to the financial statements on the Income/Expense Trends screen or go to the individual Income/Expense summary. Note: Non-Financial Chart of Accounts are not included in the calculations for the Rolling Financials Summary.
Rolling Financials Report
Financial statements from the Rolling Financials screen are selectable on the Reports Setup screen. You can print a report of the calculated spreads. (Reports > Income Expense > Rolling Financials)
Calculating Ratios
You cannot get ratios off the Rolling Financial summary screen. You must enter the financial statements into the Reports Setup screen and run the Ratio Indicator report.