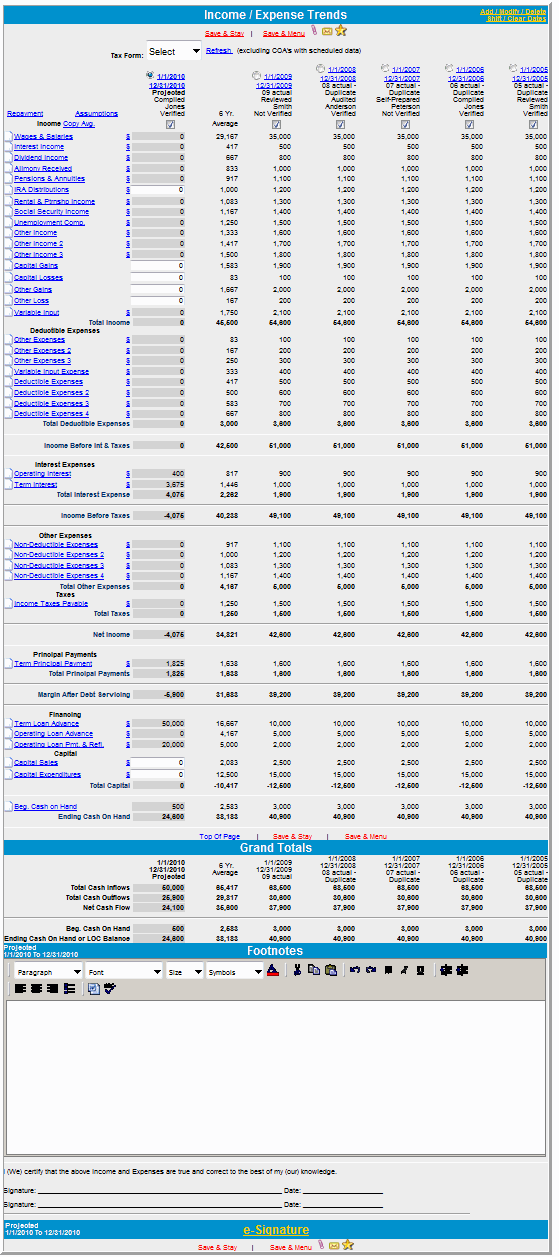
Income Expense Trends Example
Math in a Cell
You can enter math formulas in user-defined cells on the summary and trends screens to perform math calculations. You can type addition, subtraction, multiplication, division calculations and parenthesis within the math calculations. For more information, click Math in a Cell.
In and Out of Balance Indicator
The following applies to the links for the SOE (Statement of Equity) and the SCF (Statement of Cash Flow) pop-up windows:
-
If total assets do not equal total liabilities and equities (out of balance), the following message appears at the bottom of the window:
OUT OF BALANCE: Equity does not Reconcile
-
If total assets do equal total liabilities and equities (in balance), the following message appears at the bottom of the window:
IN BALANCE
Whole Numbers, Nearest Thousands and Nearest Millions
You can enter, show, and report numbers as whole numbers, nearest thousands and nearest millions. Click Whole Numbers, Thousands and Millions for more information.
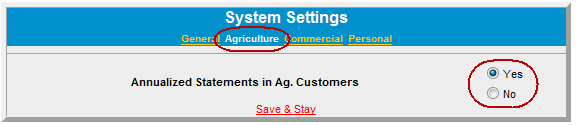
Annualized Statements
You can create annualized statements from an existing income/expense period which is less than 365 days (366 days for a leap year). Essentially, this means that you can take any interim statement (monthly, quarterly, etc.) and calculate the full year based on the available data. For example, if the quarterly statement's sales were $100,000, the annualized statement would show sales of $400,000.
Set up Functionality for Annualized Statements
You can turn on or off the functionality for Annualized Statements on the System Settings screen (Defaults->Customize->System Settings). Annualized Statements functionality is available for Agriculture, Commercial and Personal customers. To turn on or off Annualized Statements functionality, click the Yes/No buttons on the System Setting screen for the customer type. The following figure shows an Agriculture customer with the Annualized Statements functionality turned on.
Income / Expense Trends Annualized Statements Functionality
After creating an interim income/expense statement on the Income/Expense screen, open the Income/Expense Trends screen.
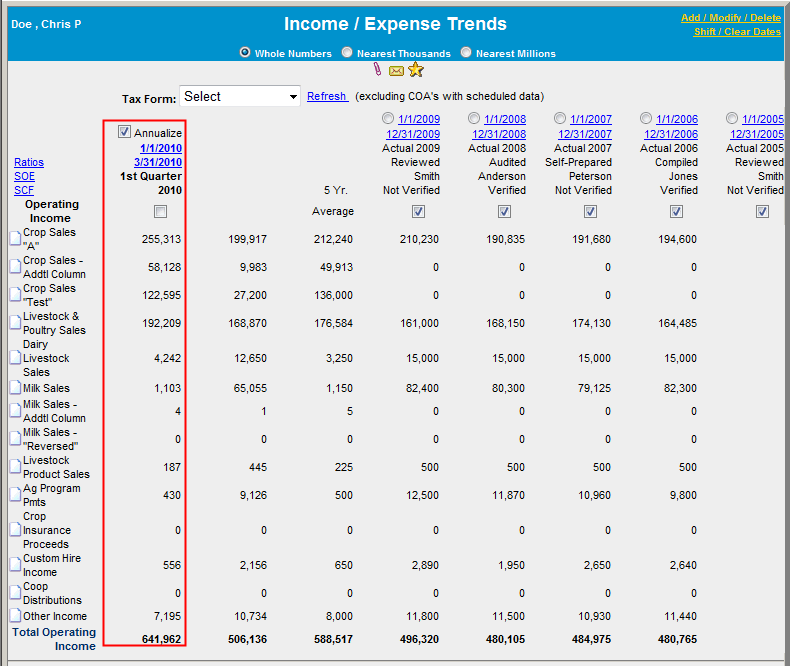
There will be an Annualize check box showing above any Inc / Exp period where the inclusive difference between the beginning and ending dates for the period is less than 365 days (366 for a leap year).
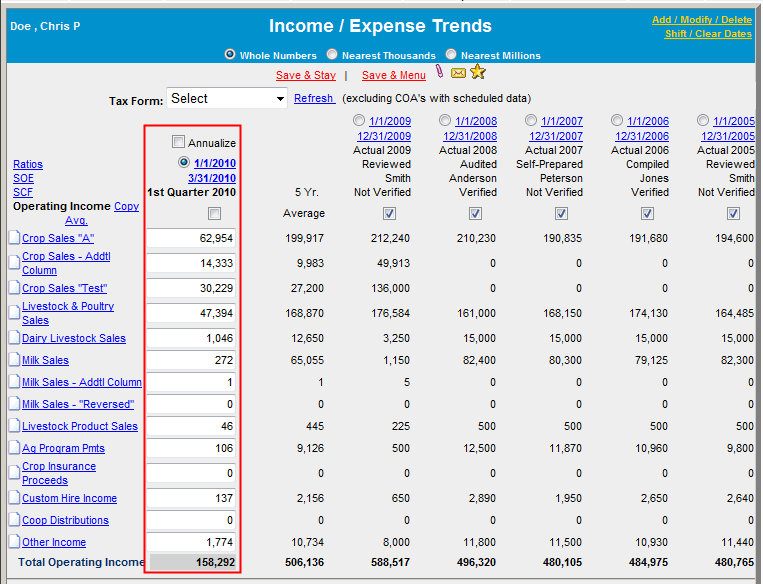
If you click the Annualize check box, the page will reload and instead of showing the inputted amounts the screen will now show the calculated annualized amounts, which will be read-only. The schedule links will be deactivated and the copy average links will be hidden. The radio button to make the column active will be removed.
If you click the Annualize check box to remove the check mark, the page loads the original functionality to so the input fields are open and the schedule links are active again.
The calculation method for this column uses the inclusive difference in days between the beginning and ending dates for the period. In the following screen figure, the beginning date is 1/1/2020 and the ending date is 3/31/2020, which means that the inclusive difference between those two dates is 90 days. Since the year 2010 is not a leap year, the formula to calculate the annualized amount is: Inputted amount * 365 / 90. When the year is a leap year, the formula uses 366 days instead of 365 days.
ERROR: Variable (Note) is undefined. Ratios & Indicators are automatically annualized and will be calculated from the inputted numbers (not the annualized numbers).
Reports
The Annualize status column will print on the Inc/Exp Trends report if the Annualize check box is selected on the Inc/Exp Trends screen). Click Income / Expense for information about the Annualized Statements functionality.