Income Expense
Projected I/E Summary
This section contains all the chart of account items (with access to schedules as needed) to show a comparison of revenue and expenses for as many years as needed. The following numbered steps correspond to the numbers on the Inc / Exp menu on the right.
Click PROJECTED Inc / Exp Sum to open the projected income/expense summary for the selected year (which appears under this menu item).
Select any projection year from this list to view it in the summary.
This is your starting point if no years exist for this customer record and it is described below. The years of data you develop here populate the list in step #2.

Add / Modify / Delete
You begin creating your projected
information by entering a beginning and ending date. You can enter the
dates in this section directly using the following format: 01/01/2002
or 01/01/02. Do not use any symbol other than "/" to separate
month/day/year. Otherwise, you can click the ![]() symbol
to open a clickable calendar.
symbol
to open a clickable calendar.
The following numbered steps correspond with the numbers in the Income / Expense figure.
Choose whether you want to add a projected or actual income/expense year.
Enter a beginning date for this projection year. It will default to the first day of the month.
Enter an ending date for this projection year. It will default to the last day of the month.
Enter a description (Ex. Projected or FYE 2000).
Enter a user-defined value, e.g., statement quality (duplicate or actual)
Enter a user-defined value, e.g., name of the accountant.
Enter a user-defined value, e.g., name of the analyst.
Enter a user-defined value, e.g., statement type (verified or unverified).
Enter a beginning balance sheet date by clicking the None Selected link. This generates a pop-up window in which you click the date. It also shows the PF link. The links that appear are dependent upon whether you chose a projected or actual year in step 1.
Enter the number of months you want for your monthly cash flow by clicking the drop list. The drop list appears; however; many months have been chosen in the monthly cash flow setup section, which is accessible by clicking # Mths link above the drop list. Click for a description of # Mths.
Click on the "Add" link to display this entry in the list.

The projected year information you added to the list appears on the screen. In additional, hypertext links on the right side of the screen are described as follows:
View Trends and Copy Default Titles Links
Click # Mths to view the Income/Expense Trends screen. Click Copy Default Titles to copy additional data categories from Lending Cloud Defaults if you are instructed by your system administrator.
Merge I/E Link
Merge Income/Expense allows you to merge up to 24 months of income/expense periods. To use this functionality, you need to make sure it is turned on within your Defaults Functionality Group. Click the "Merge I/E" link to open the Merge Income/Expense dialog box.
The Rev LOC Link
This link appears if you choose anything but None for the Monthly CF Setup.
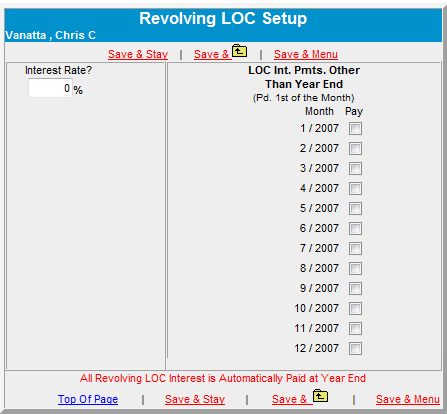
Click the Rev LOC link to generate the Revolving Line of Credit Setup dialog box.
Enter the interest rate in the Interest Rate? field.
Click the check boxes next to the months if you want interest paid other than year-end.
When
finished, click the "Save & Return" link.
The View Link
NOTE: A red asterisk next to this link indicates that this is the currently active year.
Clicking the View link to view the Proj. Inc/Exp Summary screen for this date. On the Proj. Inc/Exp Summary screen, you can calculate the average of the past years and compare that average to the projections in the current cash flow. The tools you can use include the blue-underlined (hypertext links) chart of account items that give you access to that item’s schedule, so you may make any adjustments to the information as needed. Items that are not blue-underlined mean you chose not to include them in your projection; however, they do have text data entry fields for making changes as needed.
There are some different views on the Proj. Inc/Exp Summary screen, depending upon the level of analysis you want on this customer record. If all you want is summary information (no support schedule information), enter the projected data for each account into the text data entry fields. Save your work before leaving this screen.
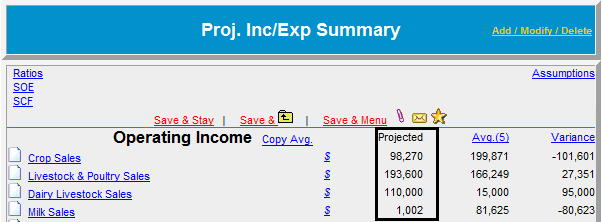
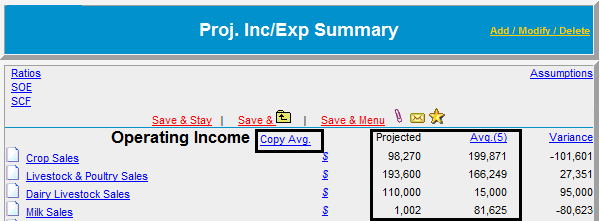
Also, if you want summary information, but you do not want to enter data into every field in the Projected column, click the Copy Avg. link. This will copy the numbers shown in the Avg. column into the text data entry fields in the Projected column.
In and Out of Balance Indicator
The following applies to the links for the SOE (Statement of Equity) and the SCF (Statement of Cash Flow) pop-up windows:
OUT OF BALANCE: (Equity does not Reconcile) If total assets do not equal total liabilities and equity, the following message appears at the bottom of the screen.
IN BALANCE: If total assets do equal total liabilities and equity, the following message appears at the bottom of the screen.
Spreading Summary Monthly Cash Flow Data
We have added the ability for you to spread a monthly cash flow allocation from the summary level input in the Projected Income/Expense area of Lending Cloud. Previously, if you wanted to spread the monthly cash flow you would have to do it in the income/expense schedules. Now, on the Proj. Inc/Exp Summary screen (sample shown below), next to the summary data input fields, there are $ hypertext links. Enter the income/expense summary number into the data entry field and click the $ link. This will generate the Monthly Allocation screen for that summary amount. Whatever amount is calculated in the Monthly Allocation screen, when you return to the summary screen for that item, the input field will disappear and the calculation from the allocation screen will display. To modify this number later, click the $ symbol to make your adjustments.
![]()
The Avg. link will display in parentheses the number of years included in the average (in this case it is 5). You can modify how many years you want represented in the average by clicking the Avg. link. This will generate the Report Setup screen (sample shown below) where you activate the check box(s) for the year(s) you want in the average. You will have to use the Income/Expense menu to return to the projected summary screen.

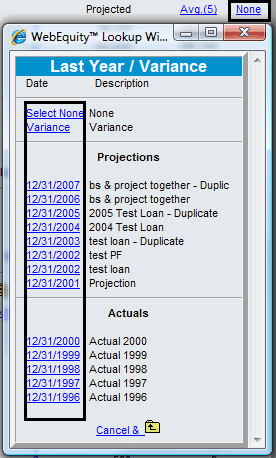
The link on the far right side of the summary screen (displayed as None in the sample on the right) is used to show you the difference between the active income/expense data and either a specific year or the variance for the historical average. Whichever link you select from the dialog box on the right is what will display on the summary screen.
So far we have been talking about using summary information for your projected income/expense information. To use more detailed information, click the chart of account items on the left side of the summary screen to access the schedule for that item. Once you do this, the text input fields in the Projected column disappear and the system automatically displays the calculated information you entered in the schedule. Schedule features are described below.

Clicking on these chart of account links (shown above left) generates a schedule screen like the sample shown below. Whether you are starting from scratch or adjusting existing data, enter the applicable information in each category from left to right and click the "Add" link on the right to add the item to your list.
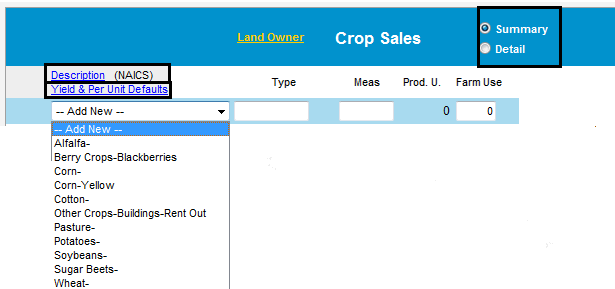
The first drop list here is for choosing the crop NAICS description. If the NAICS item you want is not in this drop list (shown below left), you can have your system administrator add it in the Defaults or you can add it yourself -- for this customer record only -- by clicking the Description (NAICS) link above the drop list. This link is available on all crop and livestock product schedules and is described below. There are radio buttons for Summary or Detail views in all crop and livestock schedules. Activating the Detail view generates some additional data entry fields for your use.
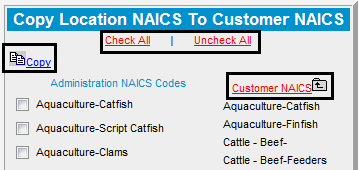
Use the Description (NAICS) link to add, modify, and delete NAICS items as needed. Clicking this link generates a page like the following figure. On this screen, you can choose an NAICS item, enter any additional description for this item in the Type data entry field and apply a measurement to the item. In the case below, it is a crop NAICS screen, so you would enter the projected yield and projected dollars per unit and click the "Add" link to place the new NAICS item in the list. If an item you want is not in the drop list you can click on the Copy Location NAICS to Client NAICS link in the top-left corner of the screen. This feature is described below. You cannot delete dimmed check boxes from the list.

Clicking the Copy Location NAICS to Client NAICS link generates the following dialog box, in which you can add any additional NAICS items from a location other than your own and that you have been given access rights to. Select the check box next to the items you want to copy and click the "Copy" link. You can speed up the activation process by using the Check All | Uncheck All links in the top-center of the dialog box. Click the Customer NAICS link to return to the Customer NAICS box.
The other useful feature on both the crop and livestock schedules is the Yield & Per Unit Defaults link. Clicking this link to showy the Copy Yield & Per Unit From Default NAICS dialog box. Select the applicable check boxes and click the Copy Now link at the bottom of the dialog box to copy this default information to the Customer NAICS Crop page.
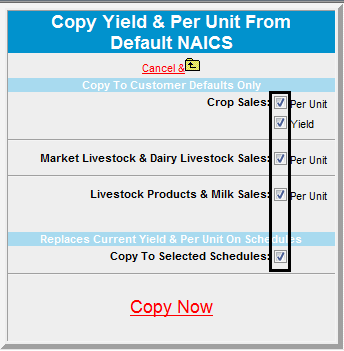
Copy defaults functionality is also available on all livestock schedules
displayed as Per
Unit Defaults. Different schedules have different categories
and to save screen real estate we have to use a lot of abbreviations.
Click the links below to view the legends for these abbreviations.
Crop Schedule Abbreviations Legend
Livestock Schedule Abbreviations Legend
Special Livestock Schedule Feature
Transfer In:
This feature is available in the "purchase livestock for resale" schedules and is used in two scenarios.
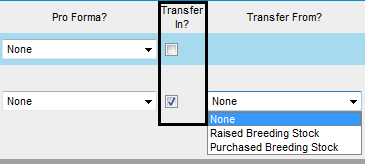
The first scenario is where you are either purchasing or raising market livestock in a projection and you will be holding those animals back to join the breeding herd instead of selling them. It allows you to take animals that would normally end up in your ending inventory on the livestock & poultry sales schedule -- which hits the pro forma balance sheet as a current asset -- and move those animals down to the intermediate section of the pro forma balance sheet as either purchased or raised breeding stock.
The second scenario is where you have breeding stock on your pro forma balance sheet intermediate assets that are expected to be culled, and you need to move those animals out of the intermediate section of the pro forma balance sheet and into the current section under market livestock.
Accessing the Monthly Cash Flow in Schedules
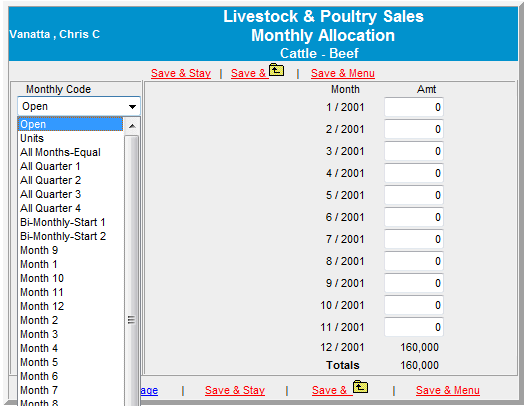
You choose the monthly cash flow codes and allocations you want to use by clicking on the links in the Sales column on the right side of the schedule (sample shown below). If the Sales amounts are not hypertext links, it means you did not activate the Monthly Cash Flow Setup feature under Add/Modify/Delete described above.

Clicking on these Sales links generates the monthly allocation pop-up window (sample shown below). Select the monthly code you want to use from the drop list on the left side of the pop-up window. Based upon your drop list choice, the Amt columns populate and calculate the total. Otherwise, enter the monthly allocation amounts manually. Save your work before returning to the income/expense schedule. You will be alerted if the last month in the allocation shows a negative amount.
Projected Income/Expense "Add/Modify/Delete" Continued...

The ACCRUAL Link
Click the Accrual link to display the accrual adjustments screen for this particular year.
The PF Link (Pro Forma)
Clicking the PF link to view displays the pro forma (projected) information for that year. This link appears after you select a beginning balance sheet date. If you do not choose this date, the PF link does not appear.
The Duplicate Link
Click the Duplicate link to duplicate this particular year's information. The duplicate will appear below the year you wanted to duplicate. Make changes to this information as needed.
Move Link
You can move a projected income/expense year down to an actual year and vice versa. To do this, click the Income/Expense Add-Modify-Delete. You will see there is a Move link to the right of each beginning/ ending balance sheet year. Click the Move link for the year you want to move and Lending Cloud moves it for you.
Track Users Link
Track Link tracks the Lock/Unlock feature to see which user has locked this Income/Expense screen.
eNotice | Attachments Icons
These features have been applied to almost every section of Lending Cloud. Click for a more detailed overview of these features.
![]()
Variable Input Feature
This feature allows you to add customized data input fields to your income / expense schedules.
Example #1 shows five fields that are already in the crop sales schedule. You can add a sixth category field by clicking on the "Chart of Accounts” menu item (it’s the last item in the Income/Expense menu).
Example
#1

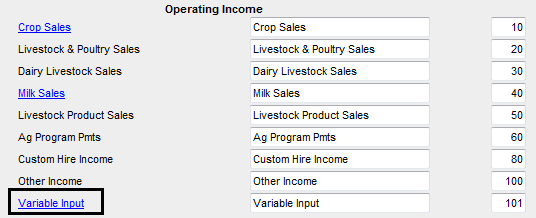
When the chart of accounts screen displays, click on the Crop Sales link (Example #2).
Example
#2

This will display Example #3. Here you can type whatever category description you want and then click the Use check box to activate its use in the crop sales schedule.
Example #3

You can see in columns 3 and 4 in the example that some categories cannot be altered (no text data entry fields and dimmed check boxes). If there is a text data entry field available, and the check box is not dimmed, you can customize that category.
Click the ![]() link
and return to the crop sales account using the Income
/ Expense menu (Example #4).
link
and return to the crop sales account using the Income
/ Expense menu (Example #4).
Example #4

You will now see (Sample #5) that the sixth field has been added to the crop sales schedule (shown as "Custom Field”).
Sample #5

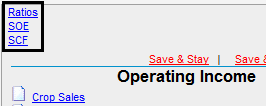
The links in the top-left corner of the projected income/expense summary screen display a pop-up window to view all the income/expense ratios and statements of owner equity and cash flows for that year's data.
On the right side of the Projected Income/Expense Summary screen there is an "Assumptions" link.
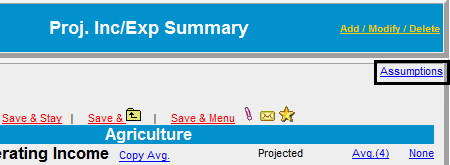
Click to view more information about the assumptions feature.
Pro Forma Financial Statements
See Pro Forma Financial Statement for instructions on how to create a pro forma financial statement.