Ag Peer Comparison Overview
The Ag Peer Comparison feature is a set of measurement tools that utilizes peer financial data to assist agricultural lenders in identifying and understanding a borrower's risk. The feature's peer benchmarking component enables lenders to compare and benchmark an agricultural producer to similar producers in their Lending Cloud portfolio. In addition, lenders can also compare and benchmark a producer to producers outside of their Lending Cloud portfolio by using a feature that incorporates state, regional, and national Moody's Ag peer data. Ag Peer Comparison is a licensed feature.
Easy-to-understand reporting also helps ag lenders show a borrower why their operation may be at a higher risk and recommend actions that the borrower could take to reduce their level of risk.
Ag Peer Comparison is structured to effectively accommodate future enhancements.
Note System administrators manage the ability of users to access Ag Peer Comparison and the ability of users and administrators to use specific functionality in the feature. Information about setting up access and controlling functionality is located in the Ag Peer Comparison System Administration Settings section.
Ag Peer Comparison User Guide
The Ag Peer Comparison User Guide also provides information about the various options within the feature You can access the guide from the Lending Cloud eHelp home page. Under Reference Guides, select End User Reference Guides > Ag Peer Comparison User Guide.
To Access Ag Peer Comparison
If you have an Ag Peer Comparison license, you can access the feature from the Lending Cloud menu while in a customer record.
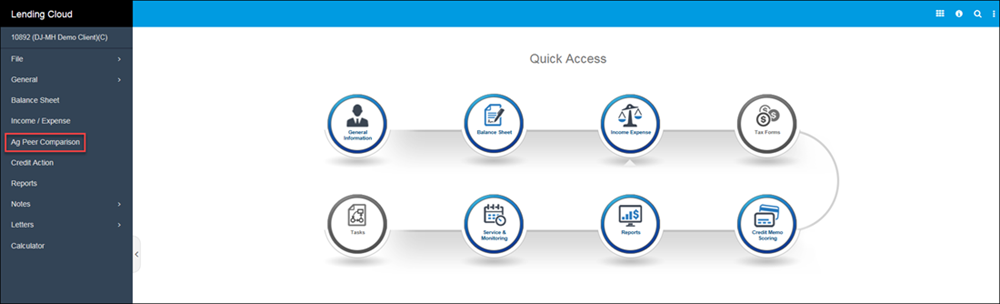
From the Lending Cloud menu, select Ag Peer Comparison. The Peer Comparison page appears. This page initially contains six preloaded graphs illustrating different key ratios that enable you to compare trends for the borrower with trends for up to four peers. 18 ratios and indicators are available for graphs. You can display up to six graphs, which are referred to as active graphs, at a time. The page also contains a text box under the active graphs in which you can enter analysis and other remarks related to the comparison.
Note The Current Ratio graph on the Peer Comparison page was previously named Liquidity Ratio. No changes were made to the data or calculations.
The Ag Peer Comparison Active Graphs Report section contains information about generating and printing a report of the active graphs that appear on the Peer Comparison page. If you provide comments in the text box on the Peer Comparison page, that information appears near the end of the report.
The Ag Peer Comparison Active Graphs With Data Tables Report section contains information about generating and printing a report of the active graphs that appear on the Peer Comparison page and the following tables related to the graphs:
-
- Values
This table contains the ratios or amounts that are displayed on a graph. - Counts
This table contains the number of statements from which the values on a graph were calculated.
- Values
If you provide comments in the text box on the Peer Comparison page, that information appears near the end of the report.
This topic contains the following sections: