Risk Dashboard Overview
The Risk Dashboard enables you to create, display, and monitor your loan information for customer groups. The dashboard assists you in performing thorough risk assessment before and after the granting of loans.
Your institution's credit actions must be scored to be eligible for inclusion in Risk Dashboard. Also, Moody's strongly recommends that your credit action decisioning forms meet certain requirements to help ensure that Risk Dashboard performs at its best and you receive the full benefits from dashboard functions.
To Set Up Credit Action Decisioning Forms for Risk Dashboard
To help obtain top performance from Risk Dashboard, ensure that your credit action decisioning forms include the following when credit actions are scored.
1. Applicant Name and/or Company Name
2. Credit Relationship group component
3. Detailed Collateral Analysis group component
4. Standard Lending Cloud ratios
Using standard Lending Cloud ratios enables the system to stress the ratios appropriately.
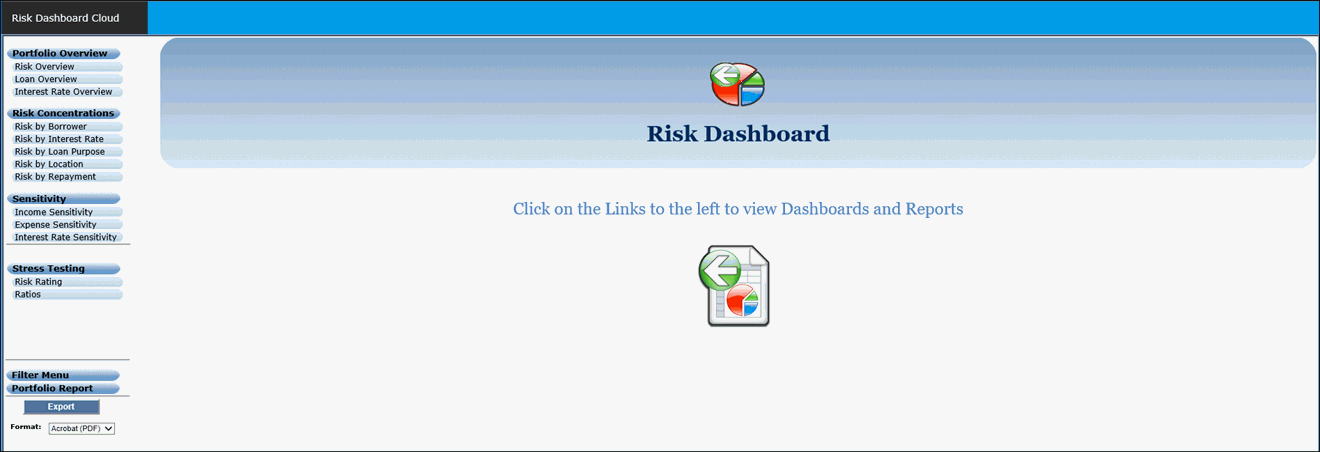
To access the dashboard, select Portfolio Management > Risk Dashboard.

Risk Dashboard Menus
Main Menu
From the Main Menu, you can view your loan information in the following ways.
-
Risk loan overviews by either risk distribution, date distribution, or interest rate distribution
-
Risk concentrations are risk to category comparisons – such as like locations, lenders, and repayments.
-
Sensitivity analyses to pro-actively manage borrower's risk issues
-
Stress testing by risk rating and ratios
The following options are available from the Main Menu.
- Portfolio Overview - Provides a highly visual consolidated representation of all the loan information that your institution has on its books, such as total loan volumes broken down by risk distribution, date distribution, or interest rate distribution.
- Risk Concentrations - Enables your institution to obtain an accurate measurement of loan concentrations by loan type, risk rating, and by branch location for assessment purposes.
- Sensitivity - Allows you to determine a borrower’s debt service margin and project what factors could impact a borrower’s ability to repay a loan such as changes in income, expenses, and interest rates.
- Stress Testing - Gives your institution the full picture of how portfolio segments could be affected by unexpected changes in risk variables and market conditions, due to factors such as liquidity, equity to asset ratio, repayment capacity, rent revenues, crop sales, and government payments.
Filter Menu
From the menu sidebar, click the Filter Menu button to display the Filter menu.
From the Filter Menu, you can create reports via segmentation of your portfolio according to the criteria you specify for specific groups of customers. The following enhanced filtering capabilities are available.
Portfolio Filter
This filter represents the predetermined settings based on specified criteria for how you want to generate risk management information. You can use the saved filter types throughout all charts and stress testing. Portfolio filters appear in a drop-down menu, from which you can select the Default Filter option or a filter that you have saved.
The following options appear under the Portfolio Filter drop-down list.
- Load - Click the Load button to generate the reports for the filter that you selected in the Portfolio Filter drop-down list.
- Edit - Click the Edit button to modify the saved filter that you selected in the Portfolio Filter drop-down list. When you click the Edit button, the Manage Portfolio Filters screen appears.
- New - Click the New button to create a new filter setting. When you click the New button, the Manage Portfolio Filters screen appears.
- Delete - Click the Delete button to remove the saved filter from the Portfolio Filter drop-down list. You cannot delete the Default Filter.
Quick Filters
These are the filters that you create for a risk analysis. The criteria that you specify is specific to borrowers and loans.
You can use quick filters based on the following criteria settings.
- Location
- Lender Staff
- Customer Type
- Type of Operation - Primary
- Loan Purpose Category
- Loan Purpose Code
- Status - Overall
- Risk Rating Score
To use quick filters
1. For each applicable filter, click the  icon or All (Click to Expand) in the filter box to display the drop-down list.
2. In each filter drop-down list, All is the default setting. You can use the default setting or select the check box for each appropriate filtering option. Click Select All to choose all options other than All. Click Clear All to clear the check box for all selected options.
3. After making your selections for the filter, click the  icon to close the drop-down list. Filter Pending appears in the filter box.
4. After completing your selections for each applicable filter, click the Apply button to apply all your quick filter settings. All (Click to Expand) replaces Filter Pending in all applicable filter boxes.
5. If needed, click the Clear button to clear all your quick filter settings. All (Click to Expand) replaces Filter Pending in all applicable filter boxes.
Portfolio Report
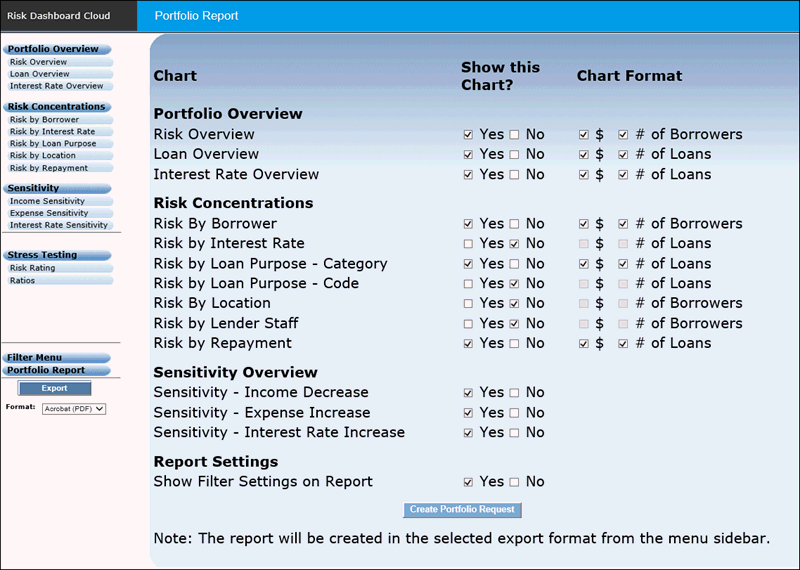
From the menu sidebar, click Portfolio Report to access the Portfolio Report screen. From this screen, you can create a document that contains reports based criteria that you specify. In addition to the default settings for the display of reports, you can save report filter settings.

To create a portfolio report
1. In the Show this Chart? column, select the Portfolio Overview, Risk Concentrations, Sensitivity Overview, and Report Settings reports to appear on the portfolio report.
2. In the Chart Format column, select one or both of the format options for each Portfolio Overview and Risk Concentrations chart to appear on the report.
3. After selecting the appropriate chart and chart format options, navigate to the Export region in the menu sidebar. From the Format drop-down list, select the format in which the report document will be created.
4. Click the Create Portfolio Request button. The system generates the Portfolio Report.
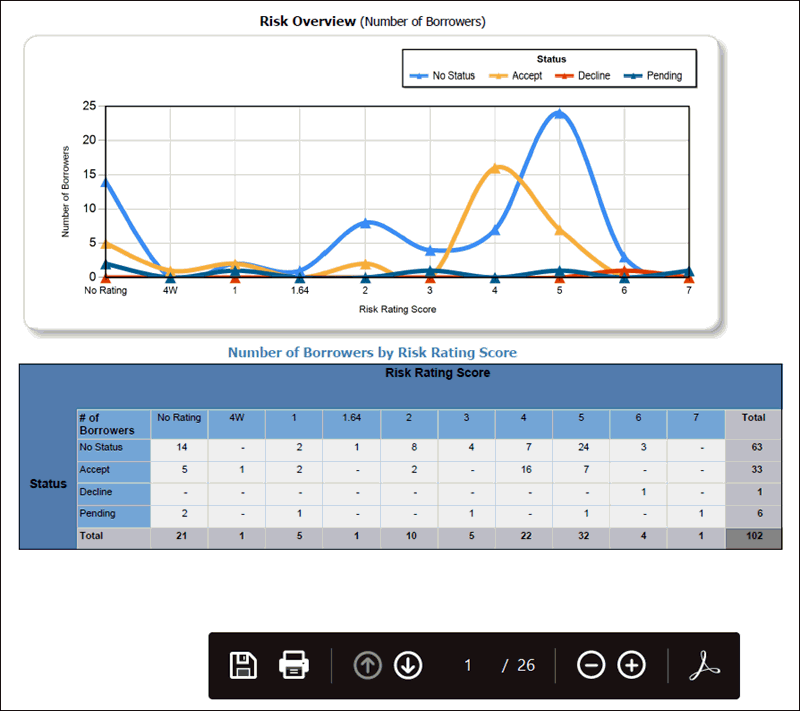
The charts are followed by a corresponding table that summarizes the data.
Following is an example of the Risk Overview chart and table based on the number of borrowers. The example is from the Portfolio Report in PDF format.

Export
Export functionality enables you to do the following.
-
Generate reports in a PDF, Word document, or Excel document
-
Print reports
-
Export report files